Report Node Guide
Overview
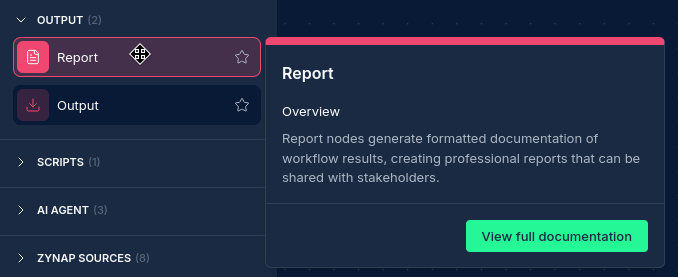
The Report Node allows you to generate professional PDF reports from your workflow data. This powerful node automatically analyzes and organizes your input data, creating well-structured, visually appealing reports that can be shared with stakeholders, clients, or team members.
Use Cases
- Creating security assessment reports
- Generating vulnerability summaries
- Producing compliance documentation
- Building executive summaries of technical findings
- Creating client deliverables with consistent formatting
- Documenting penetration test results
- Generating regular security status reports
Creating a Report Node
Basic Setup
- Drag a Report Node from the node palette onto your workflow canvas
- Connect it to one or more input nodes containing the data you want to include in the report
Configuration Options
Node Properties
| Property | Description |
|---|---|
| Name | A descriptive name for the node (will be used in report title) |
How Report Nodes Work
Using algorithms, an AI agent and a dedicated reporting tool; the Report Node uses a sophisticated multi-stage process to generate reports:
-
Data Collection and Analysis: The node collects data from all connected upstream nodes and analyzes using algorithms to understand the structure and content.
-
AI Content Organization: Based on the analysis, the node automatically organizes the data into logical sections and categories.
-
AI Report Structure Creation: The node generates a report structure with appropriate sections, headings, and content blocks.
-
PDF Generation: The structured content is formatted into a PDF document with proper styling, headers, footers, and pagination using a dedicated Zynap report generation tool.
Report Structure
Reports are automatically structured with the following components:
- Title Page: Includes report title, date, and organization information
- Table of Contents: Automatically generated based on report sections
- Executive Summary: High-level overview of the report contents
- Detailed Sections: Content organized by category or data source
- Findings/Results: Detailed presentation of key information
- Visualizations: Charts, tables, and other visual elements as appropriate
- Conclusion: Summary of key findings and insights
- Appendices: Additional technical details if needed
AI-Powered Report Generation
The Report Node leverages AI to:
- Analyze input data to identify patterns, relationships, and key information
- Determine the most appropriate report structure based on the content
- Generate meaningful visualizations of complex data
- Create professional narrative descriptions and context
- Format technical information in a clear, accessible way
Best Practices
- Meaningful Input Names: Name your upstream nodes clearly and format them correctly to help the Report Node better categorize the information
- Data Organization: Structure your input data logically for better AI performance
- Multiple Inputs: Connect multiple data sources for comprehensive reports
- Report Node Placement: Placement location of node typically does not matter, connections do
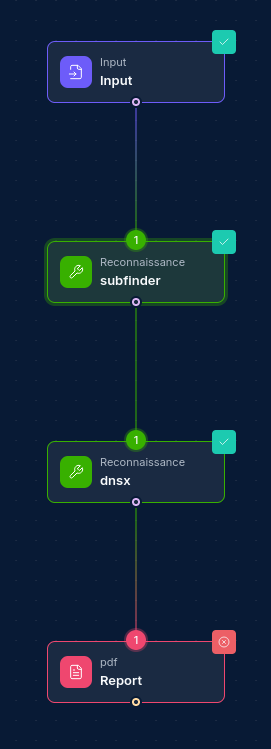
Example Report Workflow
Security Assessment Report
Input Nodes:
- Subdomain discovery results
- Vulnerability scan findings
- Port scan data
- Web technology detection
- Security misconfigurations
Generated Report Sections:
- Executive Summary
- Scope and Methodology
- Key Findings
- Technical Details
- Network Infrastructure
- Web Applications
- Vulnerabilities by Severity
- Recommendations
- Appendices
Troubleshooting
| Issue | Resolution |
|---|---|
| Missing data in report | Verify upstream node connections and data format |
| Inaccurate repot data | Reduce the volume of input data or break into multiple reports |
| Formatting issues | Ensure input data is properly structured |
| Section organization | Improve upstream node naming for better categorization |
Updated: 2025-08-04